
What research has been done in our watershed?
Stream data in the Mississippi River-Winona watershed dates back to 1932. Water quality monitoring began in 1961. All existing data was collected and analyzed in 2012.
Data came from six agencies, 136 monitoring sites and 225 programs. Approximately 20,000 sampling events and nearly 296,000 data points were recorded including nutrient, metal, nonmetal, physical, radiochemical, pesticide, bacteriological and biological data.
A specific type of data must be collected at a site for more than a year to be statistically useful. Twenty-four sites fit this requirement, with 12 suitable for long-term trend analysis.
• Strong link between stream nitrate and amount of cropland in drained area
• Nitrate concentrations are increasing
What have we learned?
Precipitation has increased here since the 1950s and land use has changed (including different farming practices and more roads, buildings and other hard surfaces), so more water is flowing through streams. Because continuous stream flow data does not exist for the last 10-20 years, we can’t quantify this.
We do know that total suspended solids and biochemical oxygen demand are decreasing in the Whitewater River and in Garvin Brook at Minnesota City.
Nitrate is the primary dissolved pollutant in the watershed and has the largest, most comprehensive data record. In our watershed the number of row crop acres correlates with the amount of nitrate in streams. Nitrate concentrations tend to be in upper reaches of watersheds where there is more cropland, and where ground water flows to streams from shallow aquifers with high nitrate concentrations.

A Legacy of Daily Stewardship
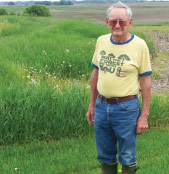
Farmer, aviator and computer expert Willis Van Norman has lived with his wife, Irene, on 150 acres above Whitewater State Park for more than 40 years. Their driveway—an airstrip they no longer use—leads to the sturdy home they built themselves, situated in a well tended paradise of forest, managed fields and a walnut woods that will one day be harvested by their grandson.
Willis loves this place and the Middle Branch of the Whitewater River running below it. He walks the stream almost every day, and for more than 12 years has measured turbidity (clarity and the amount of soil particles floating in the water) at least once a week. During one five-year period he measured turbidity and stream velocity after every rain, then delivered samples and measurements to Whitewater State Park. “I wanted to be a naturalist at Whitewater State Park at one point,” he says, “and I’ve always been interested in science. Measuring gives my walk more meaning, and I hope I’m doing something useful.”
Back at home Willis records what he finds in a spreadsheet, then sends the information to the Minnesota Pollution Control Agency at the end of the year. Because he’s monitored one stream for so long, the data he’s collected is a valuable indicator of what’s happening in the stream and our watershed. (Learn how to become a stream monitor.)
Why monitor streams?
When data is collected methodically, over a period of time in strategic locations, much can be learned about the health of a stream. Data helps us see changes, and point to the need for new land use practices upstream. Minnesota agencies, universities, citizen monitors, and others collect data, and are increasingly collaborating to make data available to all.
What research are we doing now?
Because the Whitewater River and Garvin Brook are too turbid (cloudy) to meet state water quality standards, Minnesota Pollution Control Agency (MPCA) is doing Total Maximum Daily Load Studies (TMDLs) on those streams. Targets for reducing suspended sediment (floating soil particles) are being set to protect life in those streams. Other monitoring projects identify pollutants, habitat impacts, erosion sources and trends.
Minnesota Department of Natural Resources and MPCA have established the Cooperative Stream Gauging Network to better coordinate monitoring where there is historical data.
Want to learn more? Download the full 2012 data report here.